Use Audience Crosstab to see which areas of your digital assets are actually reaching your target customers, and which ones are falling short.
To do this, build an analysis with up to 5 audiences. For example, if you have several tags on your website, you could analyze how many of your target audiences are coming to your home page, various product pages, and your purchase complete page. You could do the same for measuring your digital media, email marketing, and owned content such as your blog, ebooks, white papers and webinars, etc.
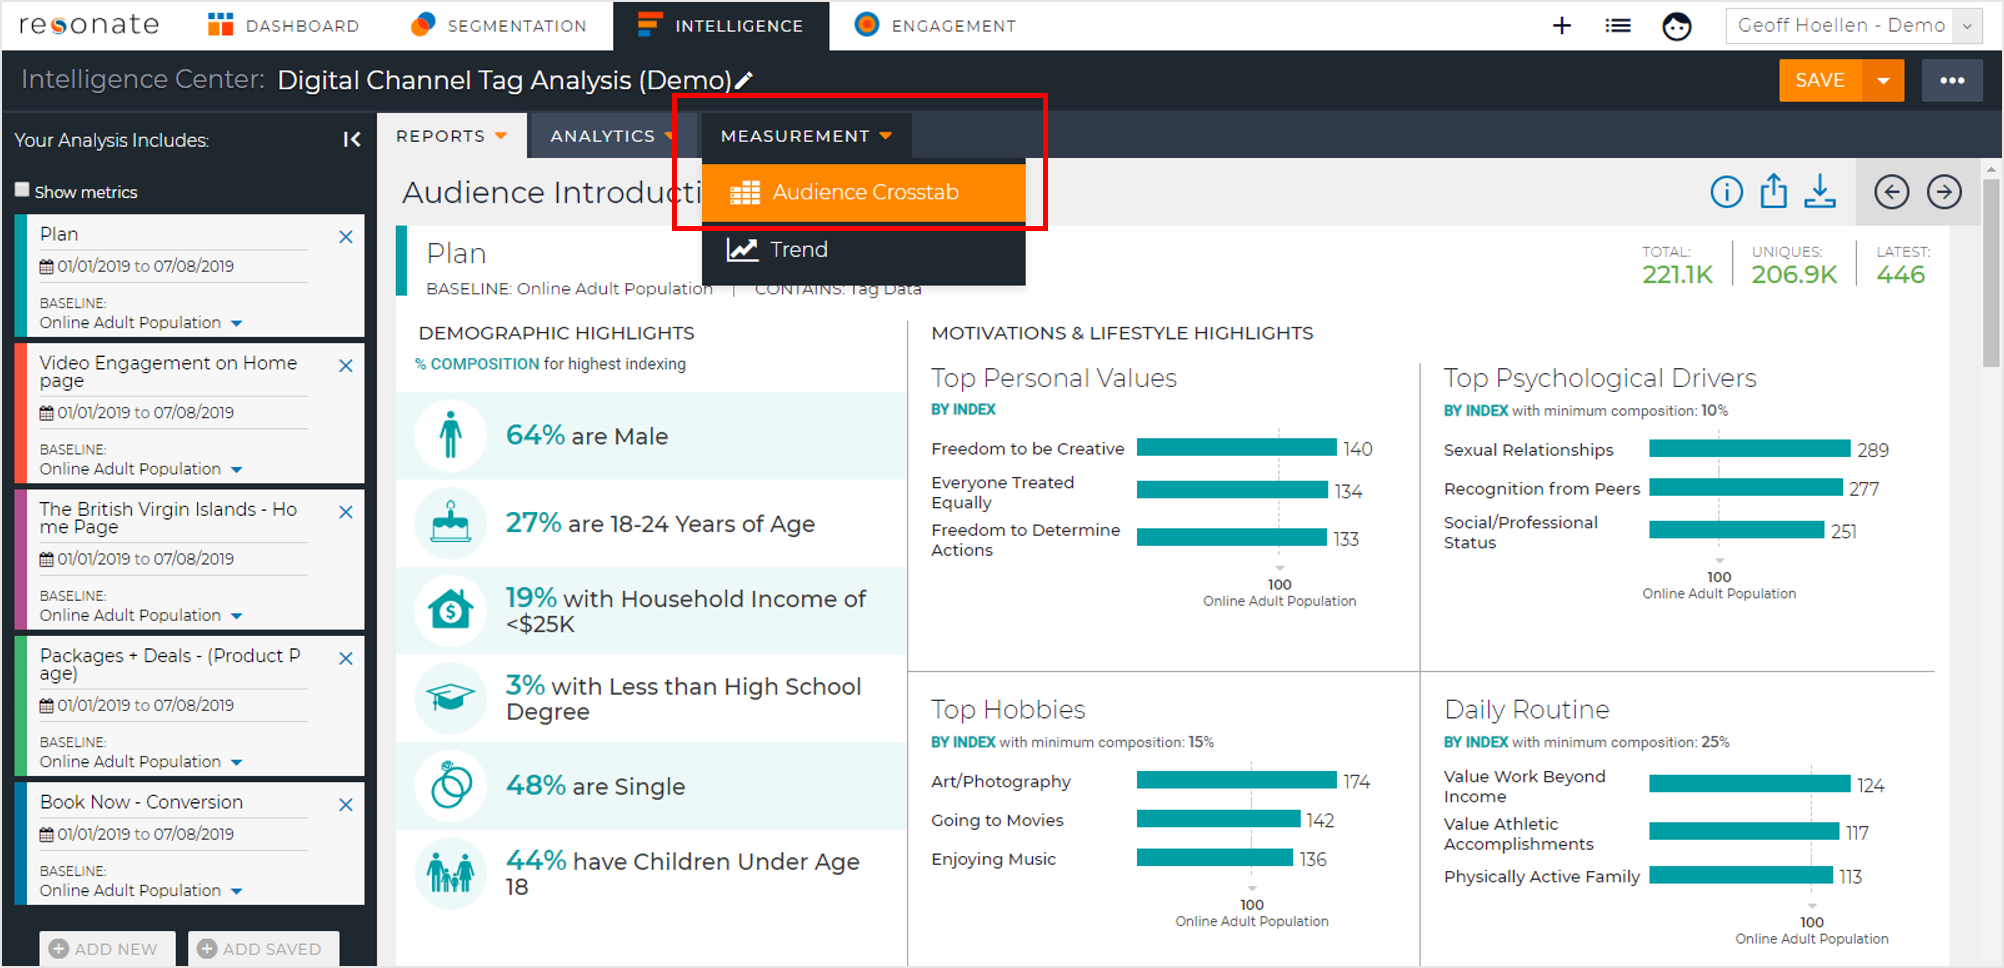
After building your analysis, open the Measurement tab and select Audience Crosstab from the menu.
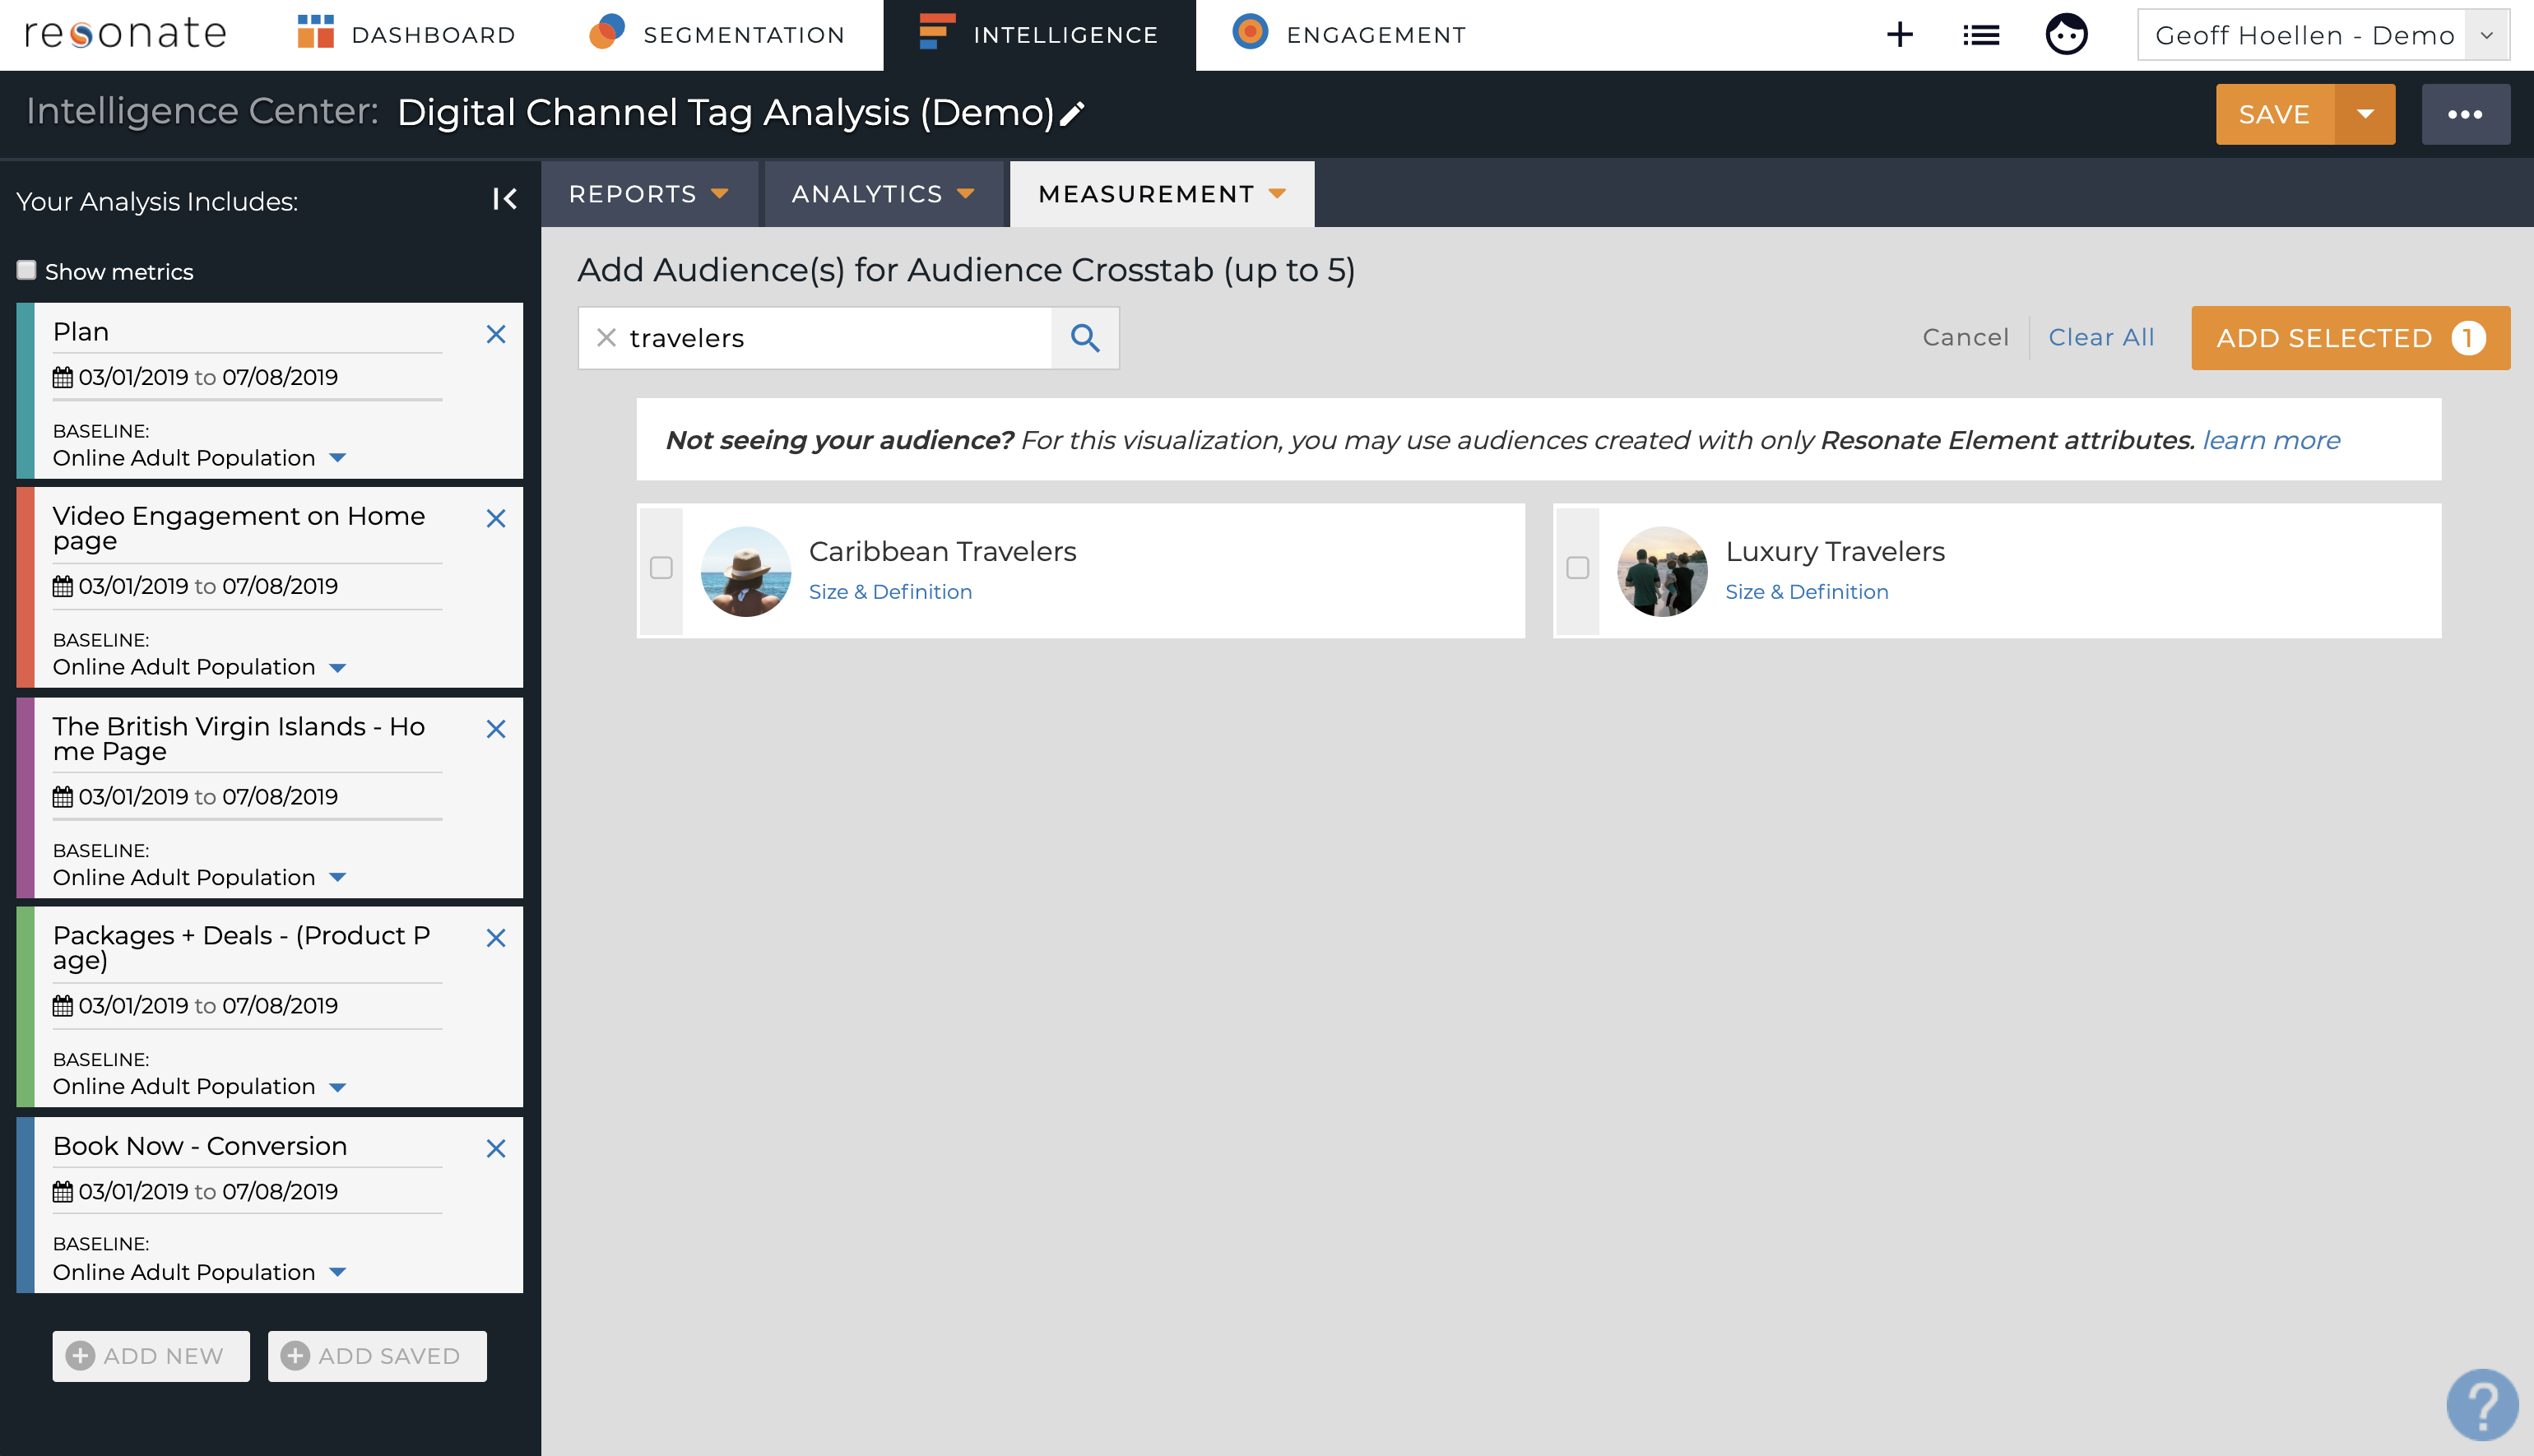
Search for audiences, like your target segments, to add to the audience crosstab, then click the checkboxes by them. You may choose up to five. When you're ready, click the Add Selected button in the top right of the page.
When the audiences are loaded, you'll be able to read the visualization and see what portion of each digital property's audience matches each audience definition.
To interpret this visualization, let's first understand the Composition number. If we look at our Homepage Tag in the first column, we can see that the Looking to Switch audience composition is at 7%. This means that 7% of the traffic to the home page matched the Looking to Switch audience definition over the measurement period.
You might ask, "Is that a good number?" That depends on whether people Looking to Switch are one of the primary segments you're targeting. If so, then this number might be lower than expected. You may want to dig into how you're driving traffic to this digital property: Is it possible that the traffic drivers to it are not hitting your target audience? Placing a Resonate Tag on the owned and paid traffic sources for your digital properties will let you evaluate further.
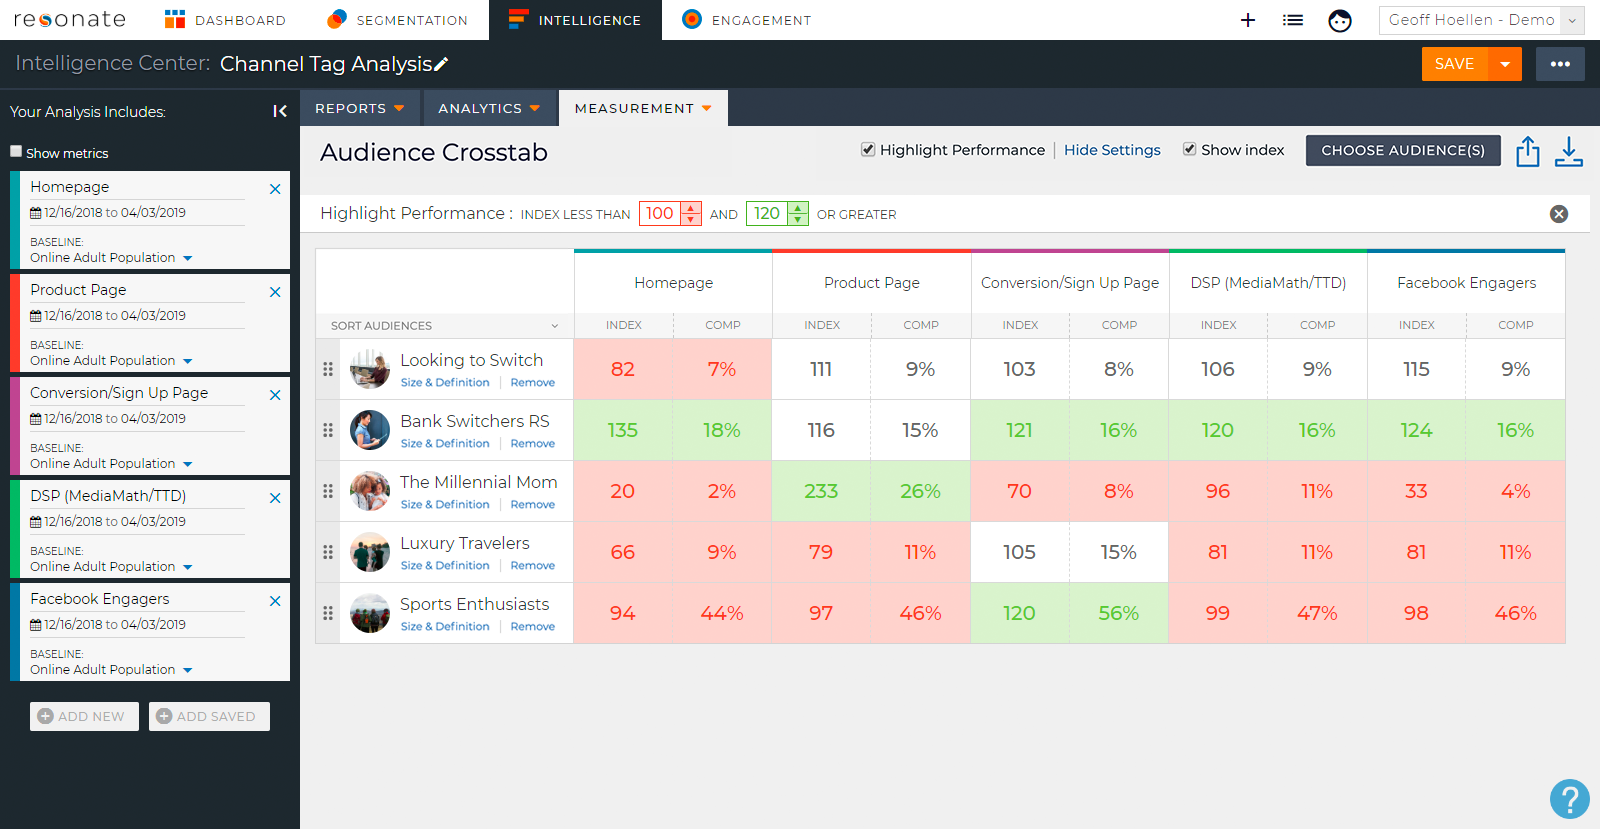
Next, let's interpret the Index number.
The Index shows prevalence in the audience you're looking at compared to prevalence in the baseline audience which, by default, is the online adult population. In this case, the Index number for Looking to Switch means that people coming to your Homepage are 18% less likely to match the Looking to Switch audience than the online adult population.
You can also uncheck the Show Index box to hide this metric and view the Composition solely.
Comparing the Index number to the Composition number, and assuming that price-conscious parents are an important segment for our business, we can glean that the people who come to our home page are less likely to match the Looking to Switch audience, and we're just not seeing a whole lot of them.
You might encounter a down arrow in your Audience Crosstab visualizations. This indicates that we're not seeing enough data for a tagged digital property from a particular target audience. This may point to a problem with your traffic sources coming to that page. Perhaps the ads you're expecting to drive a segment to your digital property are missing their mark. Take a look at the creative, messaging, delivery, etc, to learn more.
Learn how to save the Analysis here.
Comments
0 comments
Please sign in to leave a comment.